Technical stack
Presentation of the diagram
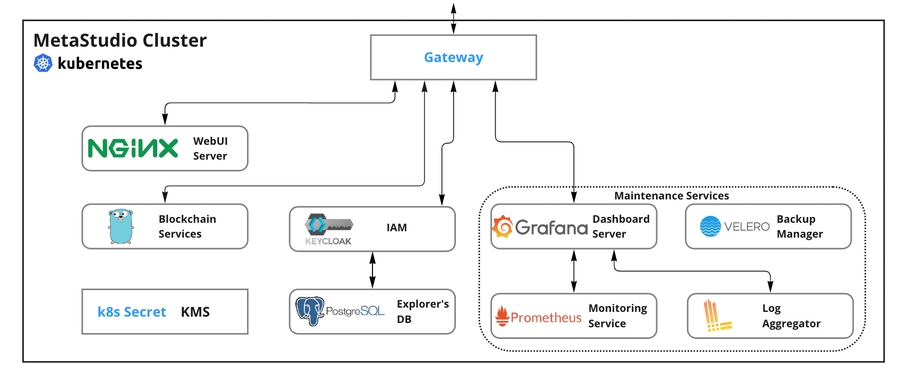
The diagram above presents the technical stack of Metastudio’s blockchain services deployed on its cloud servers. The big rectangle corresponds to the Kubernetes (k8s) zone, rounded rectangles represent pods, the plain rectangles correspond to native services. It has to be noted that all the technologies are open source.
Kubernetes
All the services are containerized and run within Kubernetes pods (sort of containers of containers, for more information please visit this page). This orchestrator facilitates the management of the services and offers a good deal of automation such as the auto-scaling, the integration of a load-balancer/reverse-proxy (e.g. the Gateway presented below), the native support of TLS and so on. Monitoring services (cf. section Prometheus and Grafana) can also be plugged to Kubernetes in order to collect performance and execution data.
Gateway
Gateway is a reverse-proxy built-in that also supports load balancing. All the communications with the outside world (i.e. incoming and outgoing data to/from the STAR solution’s Kubernetes) pass through this service.
Kubernetes secret
Kubernetes Secret, combined with the cloud infrastructure’s KMS, handles the storage of credentials of various services (e.g. credential to access the database, the blockchain node provider, the blockchain indexer etc.). The level of security and the defense mechanism of the secrets depends on the cloud infrastructure’s service. For instance, on GKE, can be plugged to the Cloud KMS to secure the secrets using software based encryption or even hardware based encryption with Cloud HSM that provides FIPS 140-2 level 3 security.
Angular
The Metastudio WebUI is developed in JavaScript using the Angular Framework.
Go
The Blockchain Services are developed in Go using the Gorilla framework from Google.
Keycloack
We use Keycloak as the IAM service for account management and definition of roles and their access.
Prometheus and Grafana
Prometheus is a monitoring service that gathers execution and performance data from all the services of Metastudio Blockchain Services. Grafana provides a WebUI to consult those data. NB: for the sake of clarity, we draw the connection between Prometheus and Grafana only. However, Prometheus is linked to all the services it monitors: Blockchain Services, Gateway, and the KMS.
Loki
Loki aggregates all the log outputs in one place and serves Grafana in order to provide a log dashboard to the administrator.
Velero
Velero is a backup manager that lets administrators configure, schedule and program backups of selected resources and volumes for an entire cluster, or part of a cluster by using namespaces or label selectors. If the cloud infrastructure provides a snapshot service such as GKE, the writing access during a backup is guaranteed and the backup file integrity is preserved.
Last updated